Munin Overview
Munin is a "networked resource monitoring tool that can help analyze resource trends." It is a great tool to help you maintain a history of what has been hapenning on your servers, using a set of graphs that can help you quickly identify trouble spots.
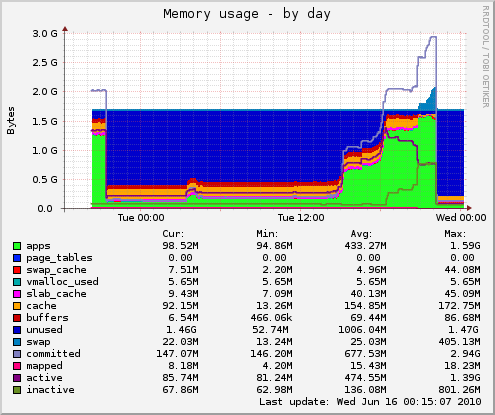
One of the great features of munin is that it is really easy to install on your servers. A default installation already monitors a lot of interesting data such as disk usage, inode usage, network errors, number of processes, cpu usage, memory usage, etc...The following is an example munin graph showing memory usage on a server, as it was experiencing some problems.
Munin is plugin-based and comes with a rich set of plugins out of the box. There are also a lot of user-contributed plugins that you might find useful. However, the real power comes with the ease with which you can write a munin plugin, using your favorite scripting language or shell.
Installing munin (Ubuntu example)
Installing munin on Ubuntu is really easy.
First, install the munin and munin-node packages
sudo aptitude install munin munin-node
Then edit to config file located at /etc/munin/munin.confan change the host to your hostname, by replacing [localhost.localdomain] with [yourdomain.com].
Next, edit the munin-node config file (/etc/munin/munin-node.conf) and change the host * line with host 127.0.0.1 for security reasons.
Finally, you can restart the munin-node using:
sudo /etc/init.d/munin-node restart
When munin runs, it will by default write all the stats html pages to /var/www/munin. In order to see them, just have your web server (Apache or nginx) serve these static html pages. We suggest you also set your web server to require authentication to view these pages. You don't want your competitor to be looking at your server's health dashboard.
Writing plugins for munin
Writing a munin plugin is very simple, since a munin plugin is simply an executable script that outputs some values in the following format:
[variable name of your choice].value [value number]
So for example, say you write a script that monitors the number of zombie processes on your server, the standard output would be:
zombie_processes.value 49
Munin will run the plugin script every 5 minutes (by default) and record the values that the script sent to standard output. Note that your script can save more than one value by just having multiple lines like the one shown above. Be aware that there are some restrictions on the characters that you can use for your field name.
In order to configure the graph that munin will draw using the numbers reported by your plugin, you need to have your plugin accept an argument of config. When the script is called with this argument, it should return a set of lines that will tell munin how to interpret the data the script returns and how to draw the graphs. In reality, your plugin script is called twice on every update cycle. Once with a config argument to emit configuration information and once to fetch the values.
To see a list of config information that you can use with your script, visit the munin wiki. A basic example, including global attributes (graph_title, graph_vlabel) and data source attributes (s2s_connections_out.label, s2s_connections_out.info, s2s_connections_in.label, s2s_connections_in.info) is shown below:
graph_title Server-to-server conections
graph_vlabel s2s
s2s_connections_out.label outgoing s2s connections
s2s_connections_out.info Number of outgoing server to server connections
s2s_connections_in.label incoming s2s connections
s2s_connections_in.info Number of incoming server to server connections
Installing munin plugins
Installing a munin plugin is simple, first make the script executable (using chmod +x [scriptname]), then move the script to /etc/munin/plugins. Doing this will install the plugin but will not activate it. To see a list of all installed plugins, you can use the following command:
sudo /usr/sbin/munin-node-configure
To activate your plugin, simply make a symlink for the plugin in the /usr/share/munin/plugins directory. For example:
sudo ln -s /usr/share/munin/plugins/zombie_processes /etc/munin/plugins/zombie_processes
Then, you need to restart munin-node after adding a new plugin:
/etc/init.d/munin-node restart
Wildcard plugins
You can write one plugin script and have it be used to monitor more than one resource by symlinking the plugin to different identifiers. The plugin will be called twice (config + fetch) for each symlink but this technique helps you write a plugin in a single file and run it more than once. The convention for these type of plugins is to call the script with a trailing underscore (for example if_, ejabberd_) and to use the symlink name to describe what data to return. For example, symlink names could be: if_eth0, if_eth1...
The ejabberd plugin that we will present here uses a wildcard plugin.
For more info, visit http://munin-monitoring.org/wiki/WildcardPlugins.
Summary
In summary, writing a munin plugin consists of the following steps:
- Write the plugin script
- Place the script in /etc/munin/plugins
- Ensure the script has appropriate execute permission
- Set plugin-specific options in /etc/munin/plugin-conf.d/munin-node
- Restart munin-node: /etc/init.d/munin-node restart
- Wait for a few minutes and check the stats pages created by munin
For more information on writing plugins, visit The Consise Guide To Writing Plugins on the munin wiki.
The ejabberd server and the ejabberdctl tool
ejabberd is an XMPP server written in erlang. After installing ejabberd on your server, you can use the ejabberdctl command-line tool to control the functioning of the ejabberd daemon and query the daemon for some information such as number of connections, number of users, number of registrations, database size, etc... For more info on how to use these tool, just type ejabberdctl on your command line without any arguments and the help file will be displayed.
The ejabberd munin plugin
The ejabberd munin plugin presented here uses, among other things, the ejabberdctl tool to get information from the running ejabberd server. The plugin was originally written by Lasse Karstensen in 2007 but had become outdated. We've updated it to work with the latest ejabberd version, removed some parts and added the ability to query the mnesia database for pubsub information.
At GroupDock, we use ejabberd mostly for the pubsub module so it was critical for us to be able to monitor what is going on with ejabberd and pubsub. We wanted to track things such as: number of pubsub nodes, number of pubsub subscriptions, memory used by mnesia for pubsub items, etc...
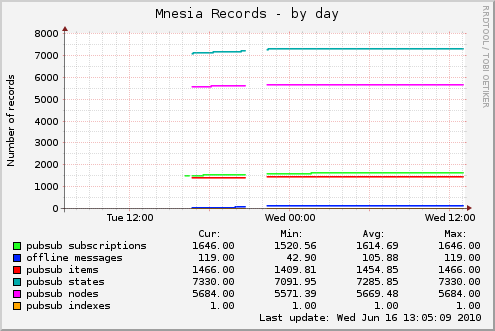
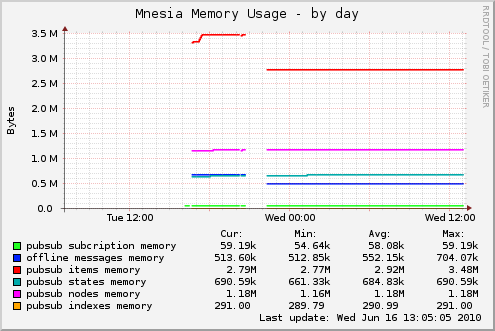
Since this plugin was originally written as a wildcard plugin, we added two new 'modes': ejabberd_mnesia_records and ejabberd_mnesia_memory. The former lets you see get information about the number of records in the mnesia database, while the latter keeps track of the memory used by the mnesia database for some specific tables. To run the plugin in each mode, the same ejabberd_ script is used, but the symlink name changes.
To install the plugin, simply download the code, make it executable (chmod +x) and move it to the /etc/munin/plugins/ directory. Then create the following symlinks:
sudo ln -s /usr/share/munin/plugins/ejabberd_ /etc/munin/plugins/ejabberd_connections
sudo ln -s /usr/share/munin/plugins/ejabberd_ /etc/munin/plugins/ejabberd_users
sudo ln -s /usr/share/munin/plugins/ejabberd_ /etc/munin/plugins/ejabberd_registrations
sudo ln -s /usr/share/munin/plugins/ejabberd_ /etc/munin/plugins/ejabberd_memory
sudo ln -s /usr/share/munin/plugins/ejabberd_ /etc/munin/plugins/ejabberd_threads
sudo ln -s /usr/share/munin/plugins/ejabberd_ /etc/munin/plugins/ejabberd_mnesia_records
sudo ln -s /usr/share/munin/plugins/ejabberd_ /etc/munin/plugins/ejabberd_mnesia_memory
You have to make one change to the ejabberd_ script: replace the location of your ejabberdctl executable in line 43: EJCTL=/path/to/ejabberdctl.
You also might have to add the following lines to the /etc/munin/plugin-conf.d/munin-node file:
[ejabberd_users]
user ejabberd_user

[ejabberd_connections]
user ejabberd_user

[ejabberd_registrations]
user ejabberd_user

[ejabberd_mnesia_records]
user ejabberd_user
timeout 60

[ejabberd_mnesia_memory]
user ejabberd_user
timeout 60

[ejabberd_*]
env.vhosts yourdomain.com yourseconddomain.com
The ejabberd_user is the user that runs the ejabberd. We are telling munin to run using that user. This is to avoid a tough to debug gotcha: the ejabberdctl needs to be run from that user otherwise you get a nasty erlang file permission error about not being able to read the erlang cookie.
The ejabberd_mnesia_* plugins take a bit longer to run so we increased the timeout for these two to 60 seconds.
Once all that is done, don't forget to restart the munin-node:
sudo /etc/init.d/munin-node restart
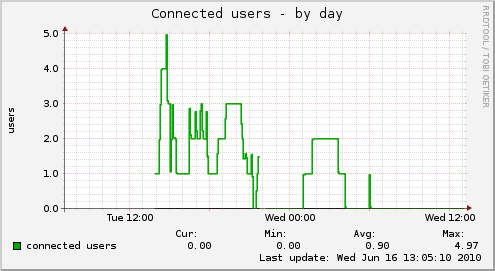
That's it, now if you wait for 10 minutes or so, you should start seeing your graphs which would eventually look like the following ones:
References/Resources
The following are great resources to learn more about munin:
blog comments powered by Disqus